 | ||
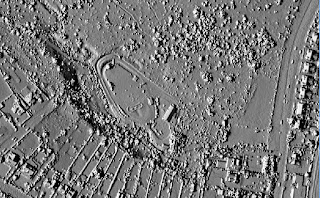
| LIDAR Surface Model of the SMEE site at Ecclesall Woods |
John Hunter, a fellow 'researcher' who is far more knowledgeable and hard working than I am, recently mentioned that the Environment Agency has placed LIDAR data for almost the whole country on the data.gov.uk web-site - the data for the 10km square around Sheffield can be found at www.geostore.com/environment-agency/survey.html#/survey?grid=SK28 . This coincided with a walk around Ecclesall Woods here in sunny Sheffield, and I wondered whether the Q-pits and other structures that I knew existed in the woods might be visible on the LIDAR data. So that meant it was play-time!
Sure enough, lots of structures were visible, and this posting outlines the process I followed - a separate post (here) will look at what I found.
Put simply (i.e. what I can understand) LIDAR bounces laser beams onto the ground from a plane. I say simply, it sends, measures and records about 100,000 'bounces' every second, times their reflection, combines this with the known position of the plane, and generates a 'point cloud' showing the exact height of points on the surface below. This is a lot of data, so the Environment Agency have reprocessed it and produced data sampled on a 2m, 1m, 50cm or 25cm grid ready for loading into a GIS system. Not all of the data covers all of the country - the 25cm grid is mainly river valleys, and none of the grids cover the high moors above Sheffield (sadly).
 |
| LIDAR Terrain Model of the SMEE site at Ecclesall Woods |
(The images are based on LIDAR data from data.gov.uk, licenced under the Open Government Licence v3.0)
(The SMEE site shown in the images is the home of the Abbeydale Minature Railway operated by the Sheffield and District Society of Model and Experimental Engineers (www.sheffieldmodelengineers.com/) - several of my former work colleagues are involved there - never, never ask whether they play with trains!)
I downloaded the 'LIDAR Composite Digital Terrain Model (DTM)' data sampled at 50cm intervals for the 10km grid square SK38. This comes as a 611mb ZIP file which contains ASC files for each 1km square within the grid - the ASC files are 'Arc/Info ASCII Grid' files which can be loaded into a GIS program as a 'raster' layer.
I have been playing with QGIS (http://www.qgis.org) for a while - it's a free open-source GIS system which runs on Windows (as well as MacOS, Linux, and others) - so I opened a new QGIS project and added the files for SK3181, SK3182, SK3281, and SK3282 covering Ecclesall Woods. (If you do this don't worry at this stage that they look a bit odd, they show the heights within each 'tile' as a shade of white to black ranging between the min. and max. for the tile - you can change it but there's no need to bother unless you want to visualise the basic data.)
Playing around, I found the 'Terrain Analysis' tool, and it's Hillshading option - using an illumination direction based on 6pm on the 1st July 2016 (azimith 270°, altitude 30° (which the tool needs as a 'vertical angle' of 60°)) gave me excellent results and highlighted lots of detail. The resulting hillshaded tiles needed a bit of adjustment (they too had set their own tonal ranges which needed to be overridden to give a nice continuous picture for the four tiles).
My next post (here) will give some results, and some related information on the structures seen. Until then ...
No comments:
Post a Comment